LiveLink | Festivals
Festival management and ticketing platform for live music events.
LiveLink had been live for about a month when Matchplatz came up. The product existed. The core discovery experience was there. What it didn’t have yet was pressure.
One of the venues I had worked with during discovery was hosting a multi-day festival and asked if I wanted to sponsor. I didn’t have the money. I offered to build their entire lineup inside LiveLink instead.
They agreed.
I had one month to design and ship the feature. I handled everything: product decisions, UX, UI, data modeling, frontend, backend adjustments, and deployment. There wasn’t room for overthinking. It had to work.
During the festival window, the page received 3,500+ views. It was the first time LiveLink had real traffic moving through it in a compressed time frame.
That’s when you find out what actually matters.
What people were trying to do
Most festival promotion assumes recognition. If people know the names, they show up. If they don’t, they’re left guessing.
This lineup was mostly local artists. Strong talent, limited name recognition. Expecting people to research every performer on their own wasn’t realistic.
Through earlier discovery research, I had already seen a pattern: at a local level, genre tags and descriptions don’t convert. Audio does.
People want to hear it.
So the goal became clear. Make listening immediate.
Extending the product
I didn’t build a separate microsite. I introduced “Festival” as a new event type inside LiveLink so it appeared directly on the discovery map.
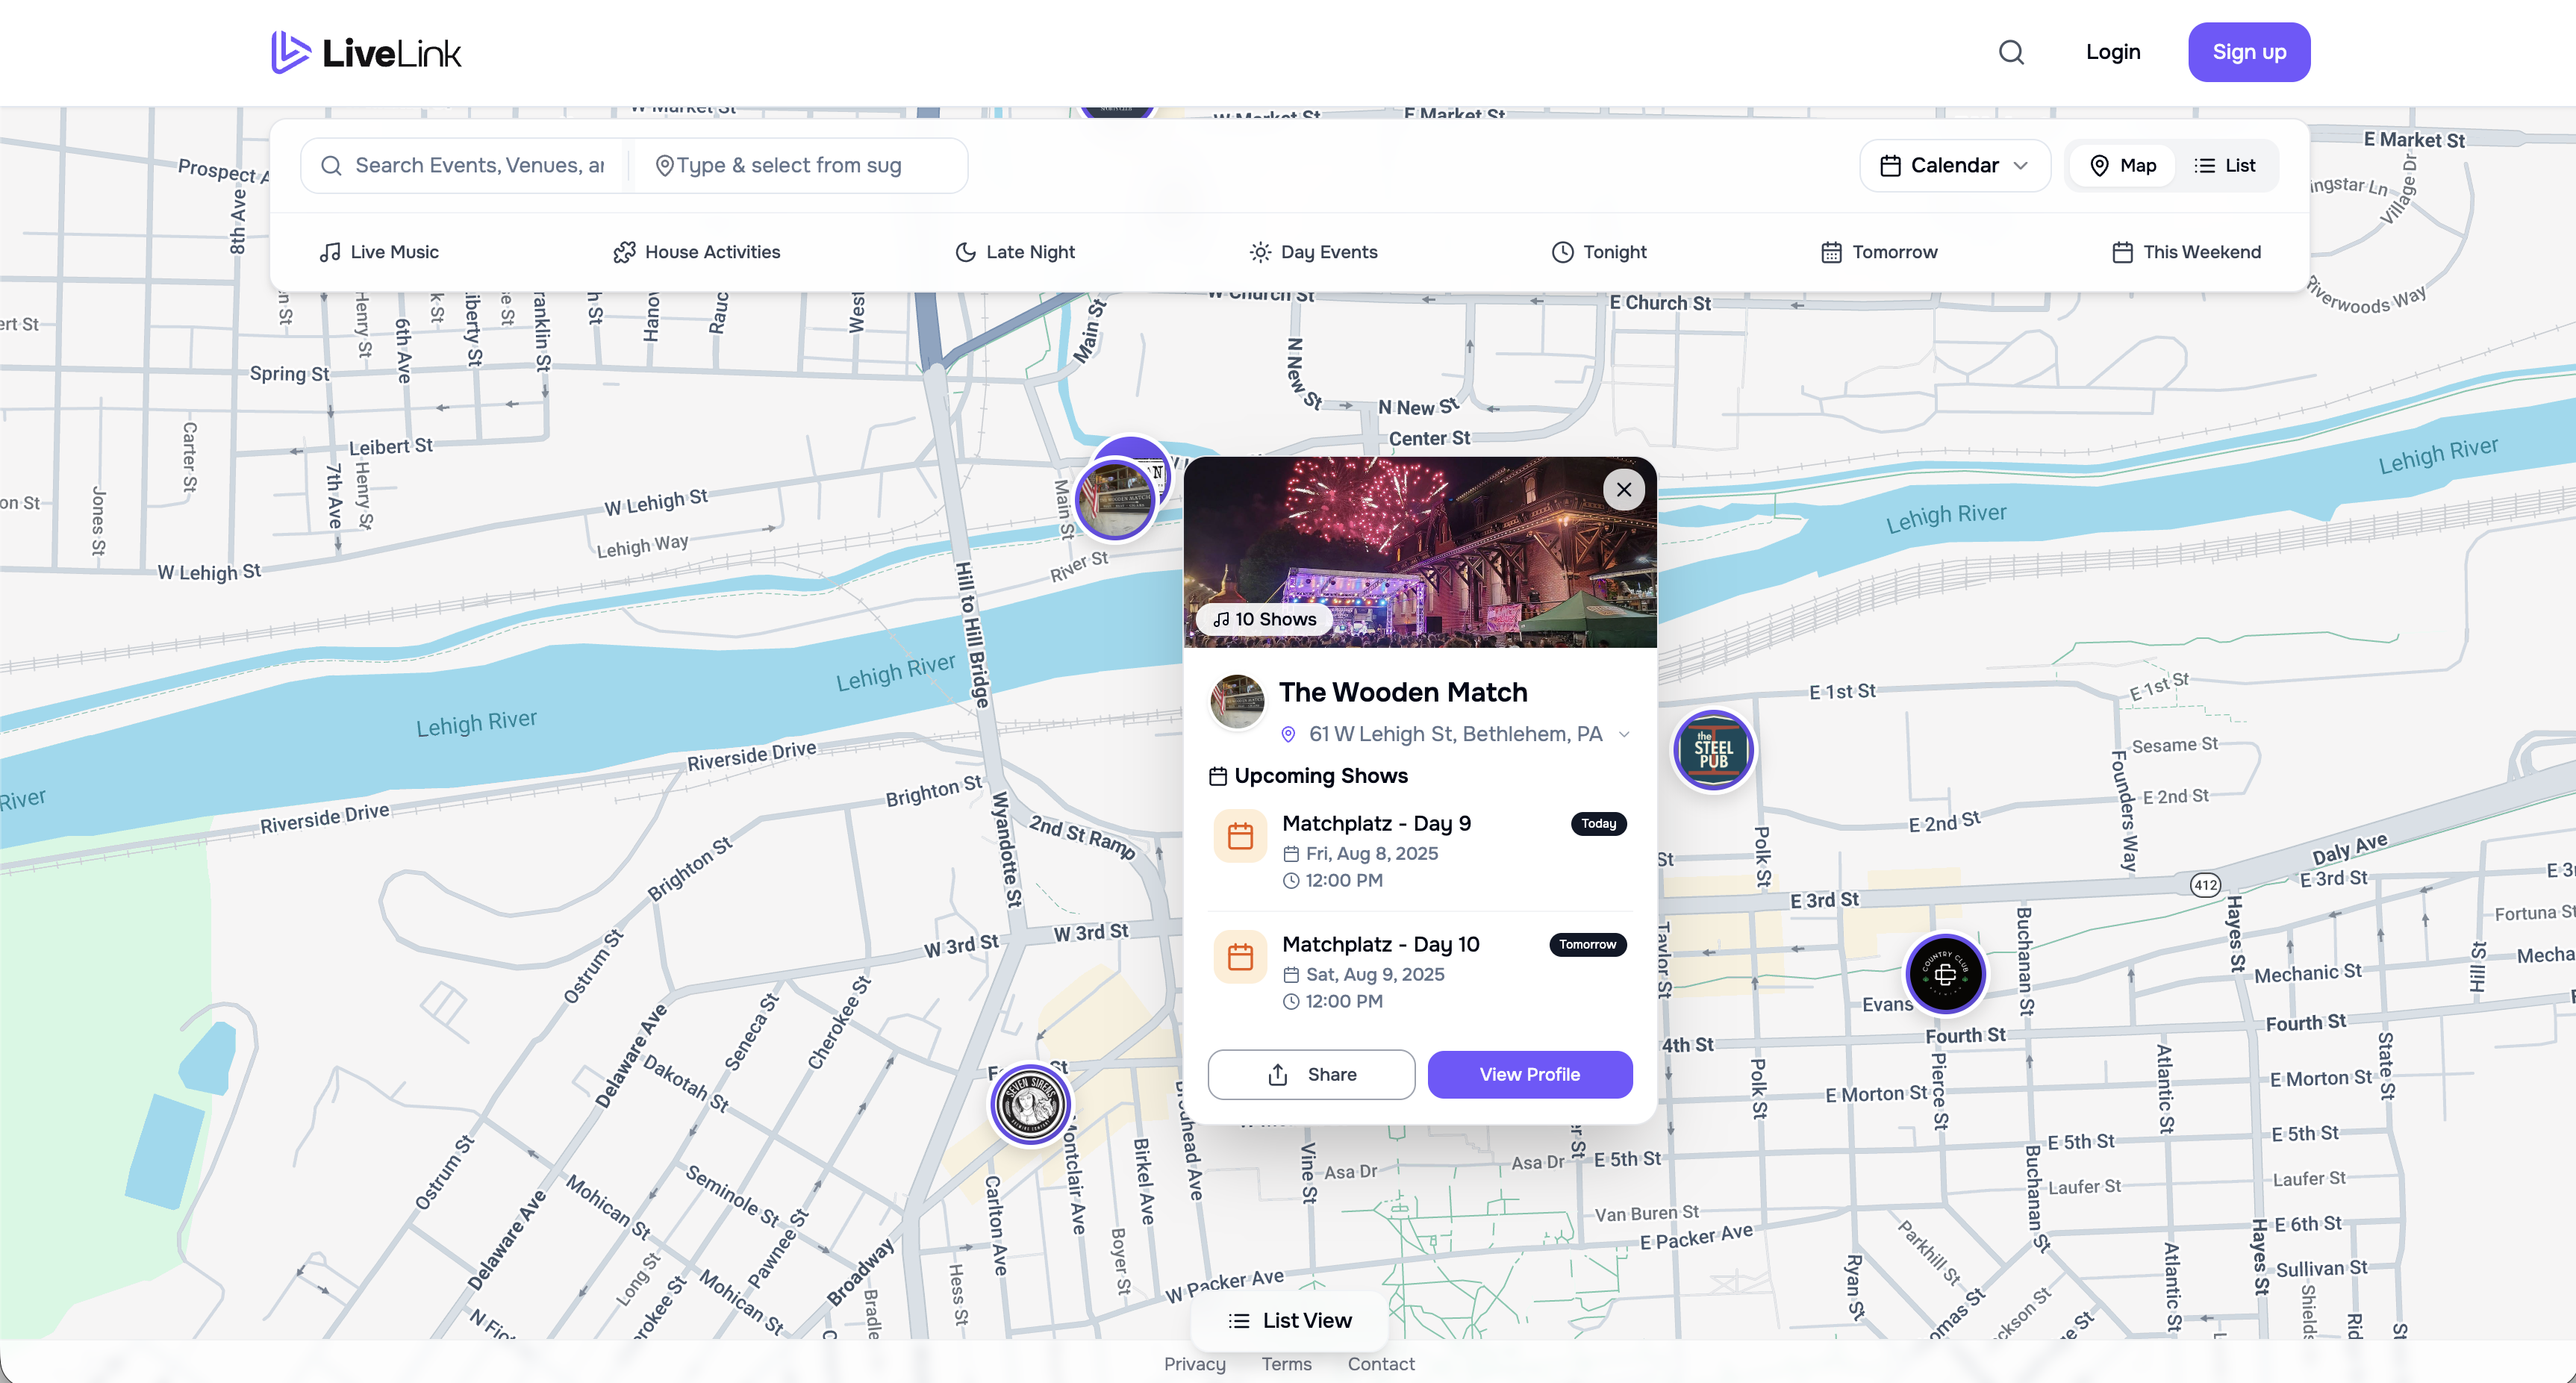 This kept the mental model intact. The festival lived inside the same ecosystem as every other event.
From there, users landed on a festival overview page.
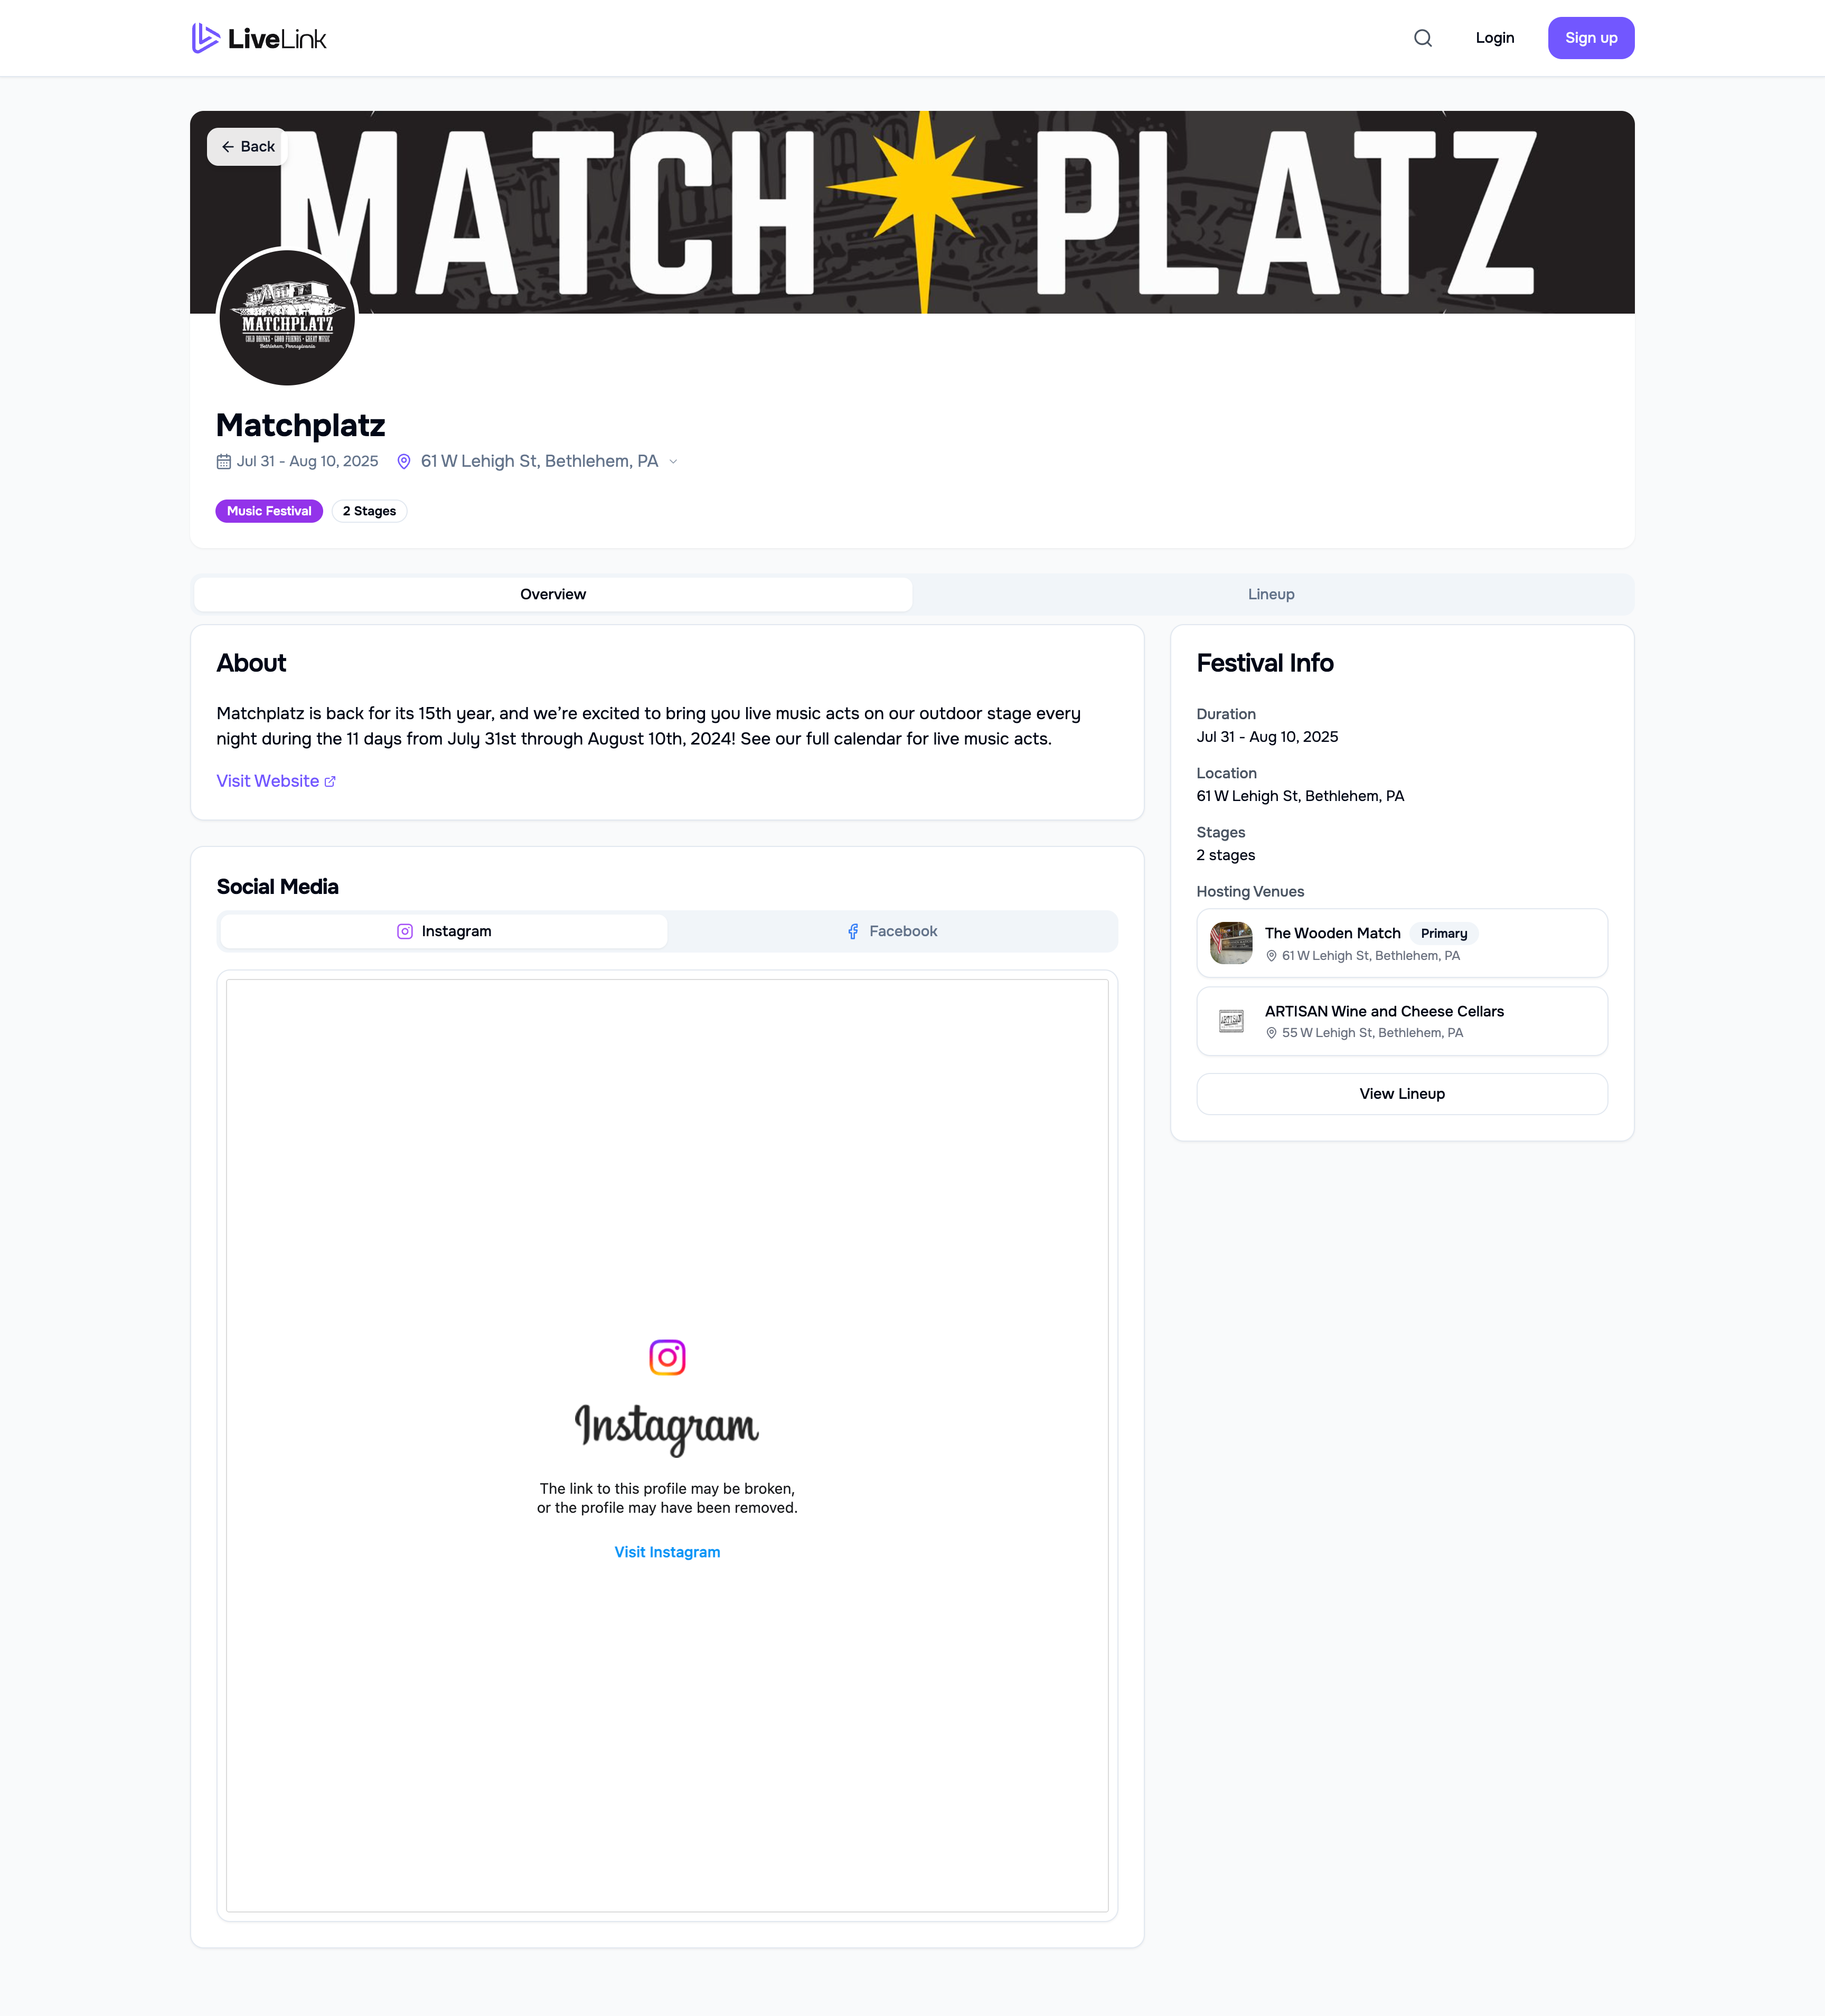 The overview is structured and restrained. Dates, location, hosting venues, and a clear path into the lineup.
Designing the lineup
The lineup needed to help people answer one question: where should I be right now?
I structured it around time.
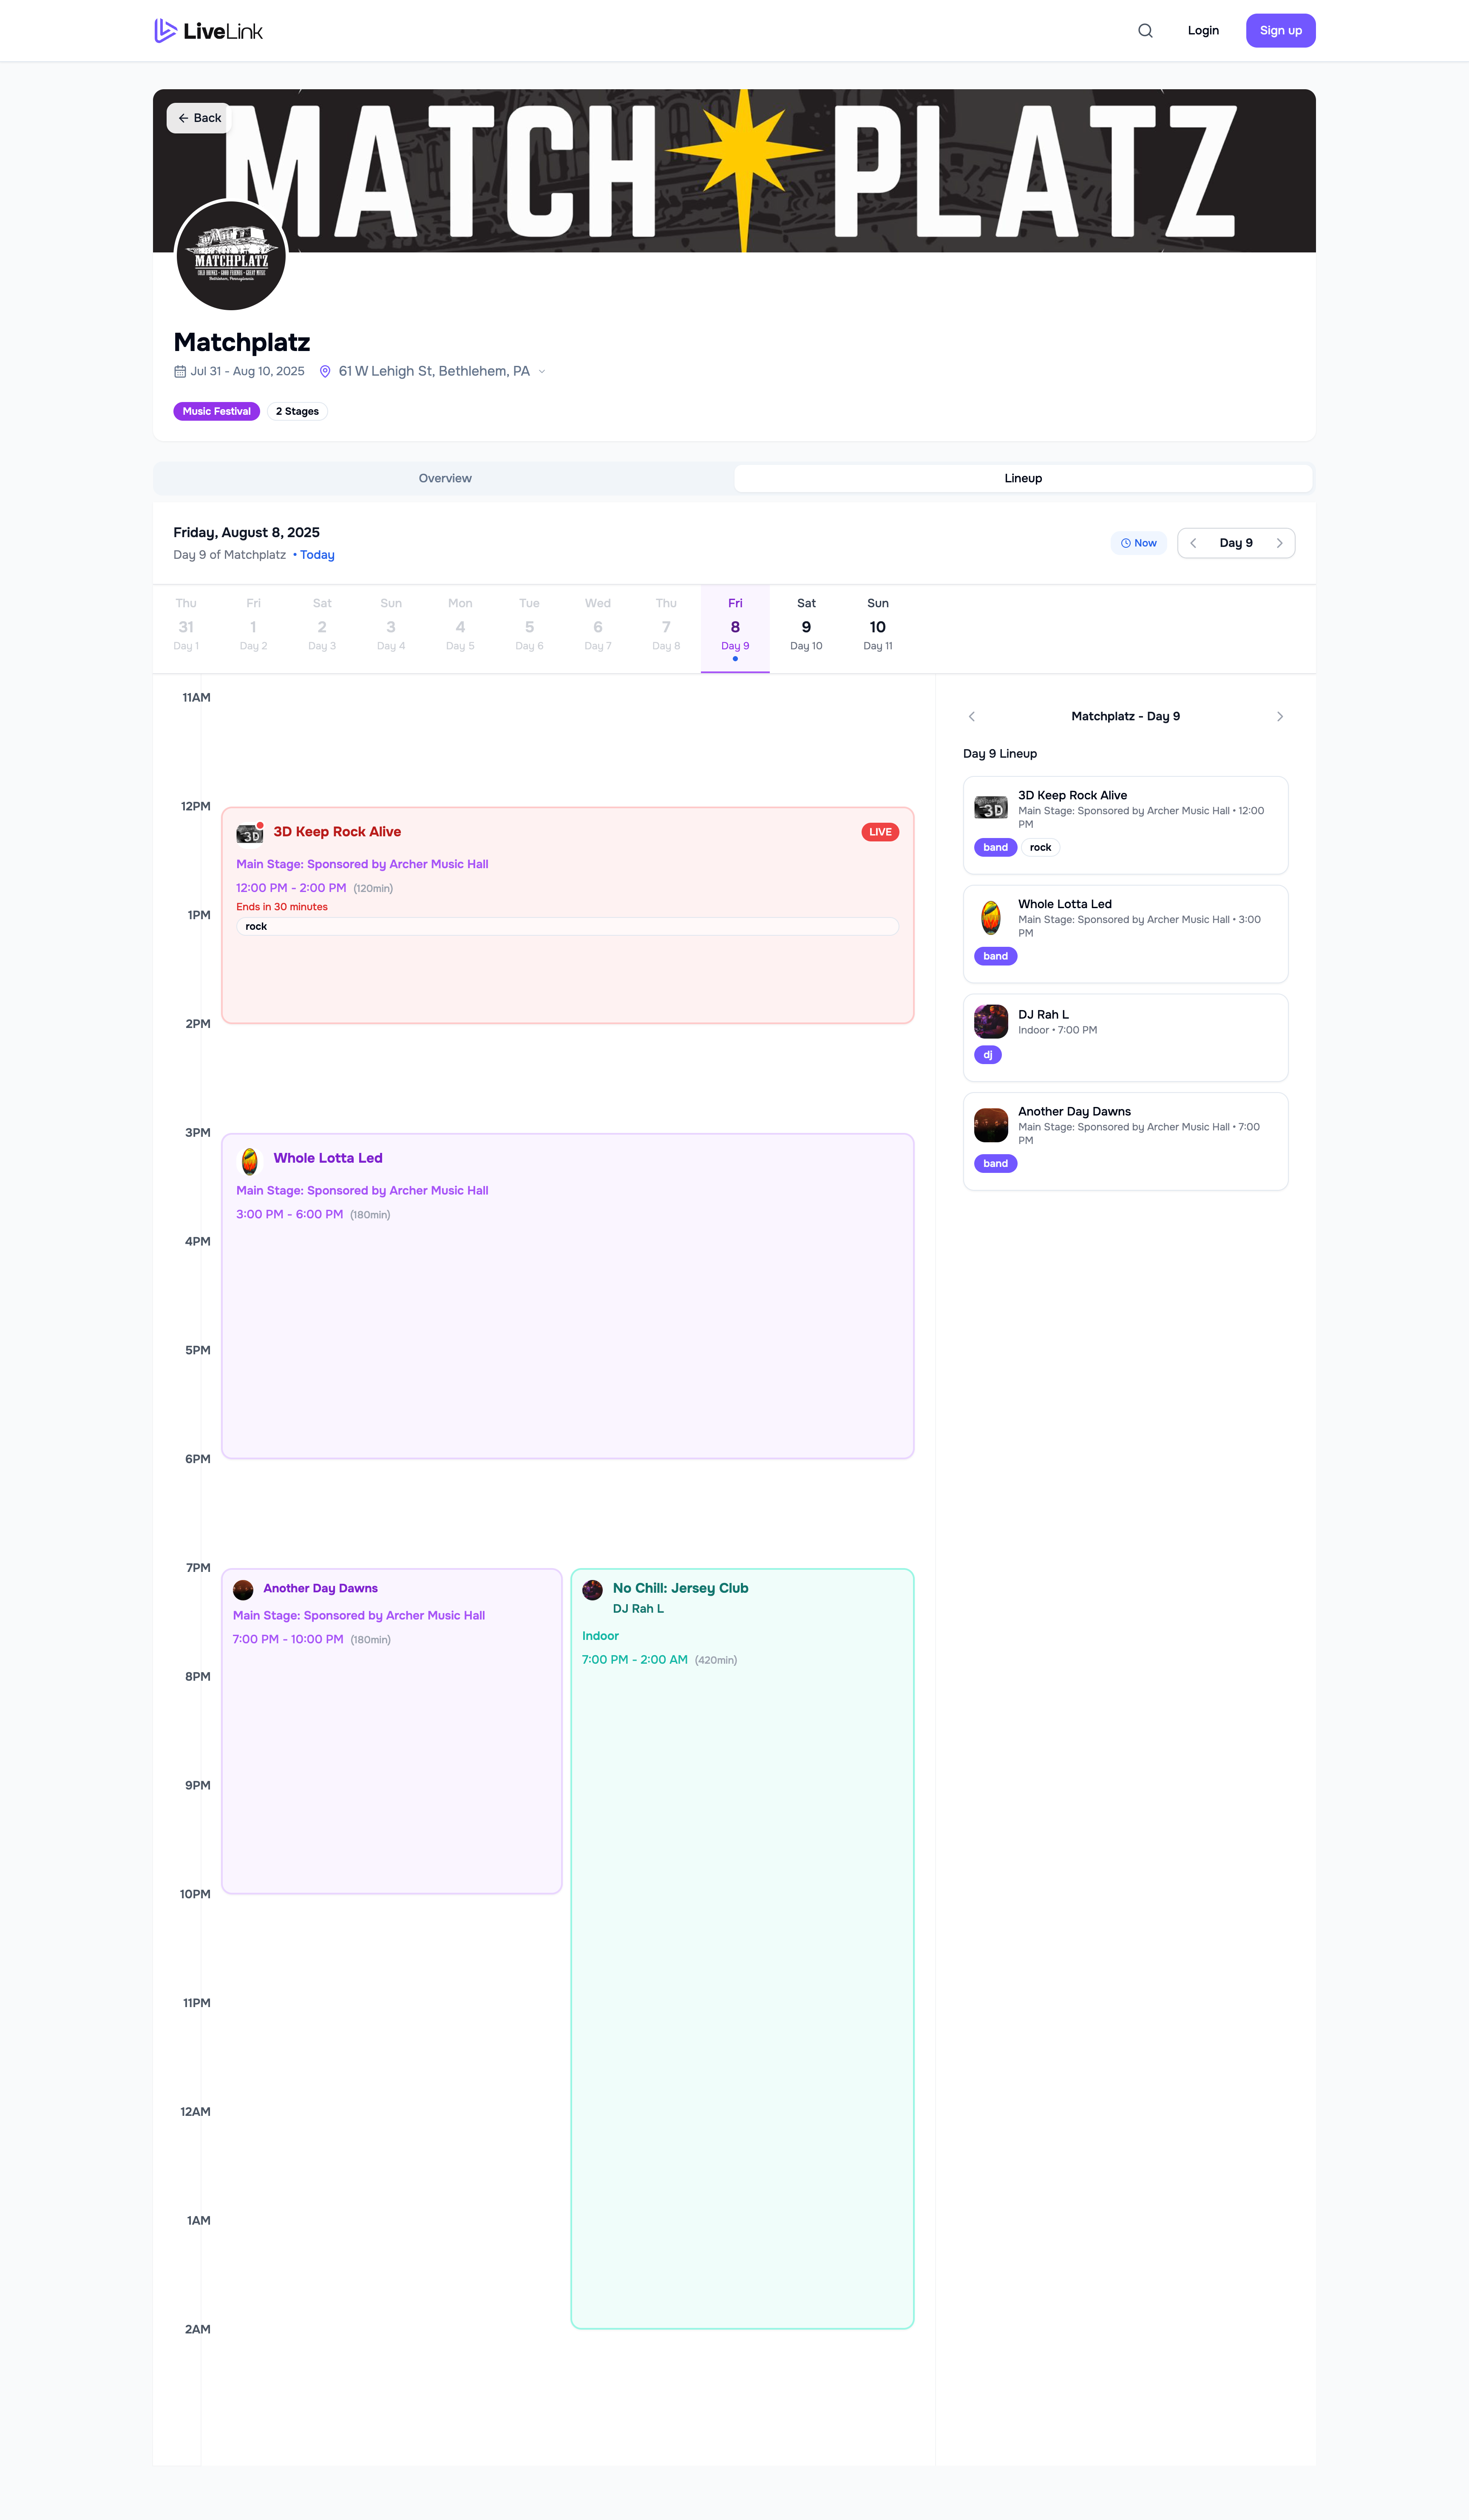 The timeline allows people to visualize the day. You can see what’s happening now, what overlaps, and how long each set runs. It reduces the mental work of decoding a poster.
There’s also a list view of performers for each day. Some people scan visually. Others prefer a simple list. Supporting both lowered friction without adding complexity.
The goal wasn’t novelty. It was clarity.
The most important feature: previews
Clicking into a set opens a detail modal with stage, time, tags, and a playable preview.
Place image: Performance detail modal with preview
The previews were manually added when creating performer profiles. It was extra work, but it aligned with what I had already learned during discovery research: for local artists, hearing them is the deciding factor.
While I was at the festival, I spoke to a few attendees. One person told me:
“I wouldn’t have come out today if I didn’t hear what they sounded like on this website.”
That comment validated the core bet. Discovery shifted from abstract browsing to real-world action.
What I’d do differently
I shipped this in a month, solo. That meant some things didn’t make the cut.
I didn’t build proper analytics instrumentation. I could see page views, but not detailed behavior. If I were building it again, I would track:
preview plays
modal open rate
navigation between days
scroll depth and time on page
Shipping proved demand. Measurement would have clarified impact.
Outcome
15,000+ page views during the festival
Strong qualitative feedback from attendees
The venue requested to run it again the following year
Whether it becomes a recurring feature depends on LiveLink’s direction, but the signal was clear. When discovery removes friction between curiosity and hearing the music, attendance changes.
Matchplatz was the first time LiveLink had to perform outside of theory. It held up.